1. Structural Phase Transision in ZnS
ZnS goes through a structural phase transition from the zincblende structure to the wurzite structure at 1020°C.
- Plot the entropy of both phases as a function of temperature (the entropy is the derivative of the free energy).
- How could you predict the temperature of this phase transition starting with the Schrödinger equation?
- What would be a good way to observe the phase transition experimentally?
- ZnS is a wide band gap semiconductor in both phases. How could you estimate the concentration of electrons in the conduction band from the band structure?
- Would either phase exhibit piezoelectricity?
Solution
Plot the entropy of both phases as a function of temperature (the entropy is the derivative of the free energy).
This is a first-order phase transition [ref]. Therefore the free energies of the two phases are not parallel at the phase transition and the entropy is discontinuous. Besides, there is a hysteresis between the two temperatures $T_c$ and $T_1$ shown in the figure.
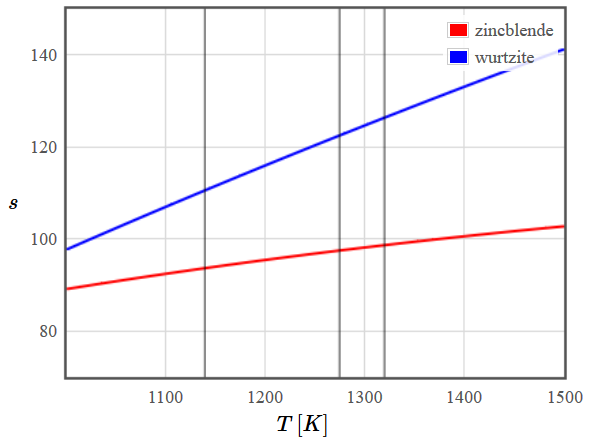 Figure 1: Schematic plot of the free energy (left) and entropy (right) of the zincblende and wurtzite structures of ZnS. The vertical black lines mark (from left to right) the temperatures $T_c$ (below which the high-temperature phase becomes unstable), $T^*$ (where the free energies are the same) and $T_1$ (above which the low temperature phase is unstable).
How could you predict the temperature of this phase transition starting with the Schrödinger equation?
A metal is usually in the phase with the lowest free energy $f(T)$. Therefore it will go through a phase transition at the temperature, where the free energies of the two phases are the same.
Like all thermodynamic properties, the free energy of a crystal can be calculated from the density of states. Both the phonon and electron contribution must be considered.
For phonons the free energy density is given by
\begin{equation*} f_{ph}(T) = k_BT \int\limits_0^\infty D(\omega)\ln\left(1-\exp\left\lbrace-\frac{\hbar\omega}{k_BT}\right\rbrace\right)d\omega \end{equation*}where $D(\omega)$ is the phonon density of states (details see http://lampz.tugraz.at/~hadley/ss2/emfield/thermo/thermo.php).
For electrons the internal energy must be calculated first as
\begin{equation*} u(T) = \int\limits_{-\infty}^\infty E D(E) f(E) dE \end{equation*}where $D(E)$ is the electron density of states and $f(E)$ the Fermi function. The integration can be simplified with the Sommerfeld expansion (http://lampz.tugraz.at/~hadley/ss1/fermigas/sommerfeldtable/sommerfeld.php). Once the internal energy is known as a function of $T$, the entropy can be calculated with the formula
\begin{equation*} s(T) = \int\limits_0^T \frac{c_V}{T'}dT' = \int\limits_0^T \frac{1}{T'}\frac{\partial u(T')}{\partial T'}dT' \end{equation*}and finally the free energy
\begin{equation*} f_{el}(T) = u(T)-Ts(T). \end{equation*}The temperature of the phase transition from zincblende to wurtzite is then obtained by solving the equation
\begin{equation*} f_{ph,z}(T) + f_{el,z}(T) = f_{ph,w}(T) + f_{el,w}(T) \end{equation*}for $T$.
What would be a good way to observe the phase transition experimentally?
Since a first order phase transition involves latent heat, the specific heat $c_V$ diverges at the temperature of the phase transition. Therefore the phase transition is visible in a measurement of the specific heat as a function of temperature, which is easy to measure.
ZnS is a wide band gap semiconductor in both phases. How could you estimate the concentration of electrons in the conduction band from the band structure?
The density of electrons in the conduction band is generally given by
\begin{equation*} n = \int\limits_{E_c}^\infty D(E)f(E)dE \end{equation*}where $E_c$ is the lower edge of the conduction band. Within the Boltzmann approximation (details see http://lampz.tugraz.at/~hadley/ss1/semiconductors/boltzmann.php) this simplifies to
\begin{equation*} n = N_c(T)\exp{\left(\frac{\mu-E_c}{k_BT}\right)}, \qquad \text{where}\qquad N_c(T) =\frac{2D_c}{\sqrt{\pi}}(k_BT)^{3/2}. \end{equation*}Here $D_c$ is the coefficient in the approximation $D(E) \approx D_c\sqrt{E-E_c}$ for the density of states near the bottom of the conduction band and can be obtained by fitting the density of states at the bottom of the conduction band.
Alternatively the coefficient $D_c$ can be expressed in terms of the effective mass $m^*$ as
\begin{equation*} D_c = \frac{(2m_e^*)^{3/2}}{2\pi^2\hbar^3} \end{equation*}and the effective mass is related to the curvature of the dispersion relation via
\begin{equation*} m^* = \frac{\hbar^2}{d^2E/dk^2}. \end{equation*}Would either phase exhibit piezoelectricity?
The piezoelectric effect is described by a rank 3 tensor,
\begin{equation*} P_i = d_{ijk}\sigma_{jk}, \end{equation*}where $\vec{P}$ is the polarization, $\sigma$ the stress tensor and $d_{ijk}$ the piezoelectric coefficients. Effects described by a tensor of odd rank can only occur in crystals without an inversion symmetry. Since neither zincblende nor wurtzite have inversion symmetry (zincblende belongs to the point group $\bar{4}3m$ and wurtzite to $6mm$, see http://lampz.tugraz.at/~hadley/ss2/crystalphysics/crystalclasses/crystalclasses.html), the material could in principle be piezoelectric in both phases.
2. Crystal Structures of CdSe
Cadmium selenide CdSe is an inorganic semiconductor that will form three different crystal structures wurzite (hexagonal), zincblende (cubic), and rock-salt (cubic).
- What can you say about the possible existence of pyroelectricity in CdSe?
- How could you calculate which of the three crystal structures would be observed for a given temperature and pressure?
- What would be a good way to determine the crystal structure experimentally?
- Sketch the dielectric function for CdSe. How could you determine the real part and the imaginary part of the dielectric function at zero frequency experimentally?
- How would you calculate the absorption coefficient of CdSe? Sketch the frequency dependence of $\alpha$ for CdSe.
Solution
What can you say about the possible existence of pyroelectricity in CdSe?
Pyroelectricity is described by a rank 1 tensor (i.e. a vector), because it relates the polarization $\vec{P}$ to the scalar temperature $T$,
\begin{equation*} P_i = \pi_i T. \end{equation*}Properties described by tensors of odd rank can only exist in crystals without inversion symmetry. The zincblende and wurtzite structures do not have an inversion symmetry (zincblende belongs to the point group $\bar{4}3m$ and wurtzite to $6mm$, see http://lampz.tugraz.at/~hadley/ss2/crystalphysics/crystalclasses/crystalclasses.html), but the NaCl structure does (its point group is $m3m$). Therefore, the pyroelectric effect could in principle occur in the zincblende and wurtzite phases, but not in the rock salt phase.
How could you calculate which of the three crystal structures would be observed for a given temperature and pressure?
A system always goes to the minimum of the Gibbs energy
\begin{equation*} G = U + pV - TS = F + pV. \end{equation*}The calculation of the free energy $F$ is already described in question 1 and the volume of the crystal can be assumed constant (but obviously structure-dependent) if the pressure change is not too big.
The Gibbs energy must be calculated for all relevant phases (structures) and at each pressure and temperature the phase with the lowest Gibbs energy will be observed.
What would be a good way to determine the crystal structure experimentally?
Crystal structures can be determined for example with x-ray diffraction (XRD). Diffraction peaks appear at $\Delta\vec{k} = \vec{k}'-\vec{k} = \vec{G}$ according to the Laue condition and their intensity is proportional to the square of the structure factor $|F_{hkl}|^2$. On the other hand the structure factors can be calculated from the crystal structure, because they are related to the Fourier transform of the electron density (the atomic form factor $f(\vec{G})$) via
\begin{equation*} F_{hkl} = \sum\limits_{j\in\text{basis}} f_j(\vec{G}_{hkl})\exp(i\vec{G}_{hkl}\cdot\vec{r}_j) \ . \end{equation*}One can start with a guess for the crystal structure and compare the calculated structure factors to the experimental results, then modify the guess a little bit and compare again, and so on until the calculations fit the experimental data.
Sketch the dielectric function for CdSe. How could you determine the real part and the imaginary part of the dielectric function at zero frequency experimentally?
See question 1 in Linear Response Theory d and e.
How would you calculate the absorption coefficient of CdSe? Sketch the frequency dependence of $\boldsymbol{\alpha}$ for CdSe.
Absorption of electromagnetic waves happens mainly by exciting electrons to higher states (in insulators and semiconductors these are predominantly interband transitions from the valence band to the conduction band). Therefore the absorption can be calculated from the band structure by considering all possible transitions from filled states to empty states and calculating the transition rates with Fermi's golden rule. If phonons are not taken into account, only transitions at the same $\vec{k}$ are possible, because the momentum that photons carry is negligible compared to typical Brioullin zone dimensions:
\begin{equation*} k_{ph} = \frac{2\pi}{\lambda} \sim 10^{-3}~\mathrm{A}^{-1} \ , \qquad k_{BZ} \sim \frac{\pi}{a} \sim 1~\mathrm{A}^{-1} \ . \end{equation*}In particular there will be peaks in the optical absorption at the energies, where bands are nearly parallel over many $\vec{k}$ values, because then many transitions contribute to the absorption at these energies.
In figure 2 the absorption coefficient of a semiconductor is sketched. Below the band gap there are no allowed transitions and therefore no absorption.
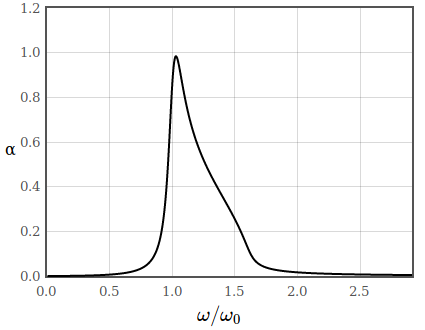 Figure 2: Absorption coefficient of a semiconductor.
3. Piezo-thermal Conductivity
The piezo-thermal conductivity describes how stress induces changes in the thermal conductivity. The stress changes the arrangement of the atoms in the crystal.
- The thermal conductivity has two contributions that are typically calculated separately. What are these two contributions?
- How can the stress lead to a change in the thermal conductivity? How could this be calculated starting from the arrangement of atoms in the crystal?
Solution
The thermal conductivity has two contributions that are typically calculated separately. What are these two contributions?
Heat is transported by phonons (lattice vibrations), but in electrically conducting materials the moving electrons also carry energy and therefore contribute to the thermal conductivity.
How can the stress lead to a change in the thermal conductivity? How could this be calculated starting from the arrangement of atoms in the crystal?
Stress generally causes strain and therefore changes the arrangement of the atoms. This in turn leads to changes in both the phonon and electron dispersion relations and therefore in both contributions to the thermal conductivity.
- Phonon contribution:
Transport of phonons is a diffusive process and can therefore be described with Fick's law
\begin{equation*} \vec{j} = -D\nabla n \end{equation*}where $\vec{j}$ is the phonon current, $n$ the phonon density and $D$ the diffusion constant. The heat current carried by phonons is given in terms of the average phonon energy $\bar{E}$ by
\begin{equation*} \vec{j}_Q = \bar{E}\vec{j} = -D\nabla\left(\bar{E}n\right) = -D\nabla u, \end{equation*}because $\bar{E}n$ is simply the phonon contribution to the internal energy density. Assuming that $u$ only depends on the position via the temperature this can be rewritten as
\begin{equation*} \vec{j}_Q = -D\frac{\partial u}{\partial T}\nabla T = -Dc_{V}\nabla T . \end{equation*}Since the definition of the thermal conductivity tensor $K$ is $\vec{j}_Q = -K\nabla T$, the phonon contribution to thermal conductivity is
\begin{equation*} K_{ph} = Dc_{V} \end{equation*}The phonon contribution to the specific heat can be calculated from the phonon density of states by differentiating the internal energy contribution:
\begin{equation*} c_V = \frac{\partial u}{\partial T} = \frac{\partial}{\partial T}\int\limits_{0}^{\infty} E D(E) f(E) dE. \end{equation*}The diffusion constant can be calculated by considering all types of phonon scattering.
- Electron contribution:
The electronic contribution to thermal conductivity can be calculated from the Boltzmann equation. In general the heat current is given by
\begin{equation*} \vec{j}_Q= \int \vec{v}_{\vec{k}}\left( E(\vec{k}) - \mu \right) D(\vec{k})f(\vec{k})d^3k. \end{equation*}and by calculating the distribution function $f$ from the Boltzmann equation in the relaxation time approximation (see http://lampz.tugraz.at/~hadley/ss2/transport/relax.php) we arrive at the following expression for the thermal conductivity:
\begin{equation*} K_{ij}=\frac{1}{4\pi^3\hbar^2T}\int \tau(\vec{k}) \frac{\partial f_0}{\partial \mu} \left( E(\vec{k}) - \mu \right) \nabla_{\vec{k}}E(\vec{k})\cdot\hat{e}_i \left( E(\vec{k}) - \mu \right) \nabla_{\vec{k}}E(\vec{k})\cdot\hat{e}_j d^3k. \end{equation*}Here $E(\vec{k})$ is the electron dispersion relation and $\tau$ the relaxation time.
- Phonon contribution:
4. Piezoconductivity
The piezoconductivity describes how stress induces changes in the electrical conductivity. This effect is used in accelerometers that are in most mobile phones.
- How can the stress lead to a change in the electrical conductivity? How could this be calculated? What kind of material would have a large piezoconductivity?
Solution
How can the stress lead to a change in the electrical conductivity? How could this be calculated? What kind of material would have a large piezoconductivity?
The deformation induced by the stress leads to changes in the electronic band structure and therefore also the electrical conductivity. This effect is particularly strong in semiconductors, where minor changes in the band structure can lead to large changes in electrical conductivity.
For a given arrangement of atoms the conductivity can be calculated from the electron dispersion relation using the Boltzmann equation. The electrical current density is given by
\begin{equation*} \vec{j}_{\text{elec}}= \frac{e}{4\pi^3\hbar^2}\int \tau (\vec{k}) \frac{\partial f_0}{\partial \mu}\nabla_{\vec{k}}E(\vec{k})\left( \nabla_{\vec{k}}E(\vec{k})\cdot\left(\nabla_{\vec{r}}\tilde{\mu}+\frac{E(\vec{k})-\mu}{T}\nabla_{\vec{r}}T \right) \right) d^3k. \end{equation*}and by calculating the distribution function $f$ from the Boltzmann equation in the relaxation time approximation (see http://lampz.tugraz.at/~hadley/ss2/transport/relax.php) we arrive at the following expression for the electrical conductivity:
\begin{equation*} \sigma_{ij}=\frac{e^2}{4\pi^3\hbar^2}\int \tau(\vec{k}) \frac{\partial f_0}{\partial \mu}\nabla_{\vec{k}}E(\vec{k})\cdot \hat{e}_i\left( \nabla_{\vec{k}}E(\vec{k})\cdot \hat{e}_j\right) d^3k. \end{equation*}Here $E(\vec{k})$ is the electron dispersion relation and $\tau$ the relaxation time.
5. Piezoresistivity
The piezoresistive effect describes how the electrical resistivity changes when strain is applied to a crystal. Silicon has a relatively large piezoresistive effect.
- Applying pressure to silicon changes the band gap. Describe how you could calculate the piezoresistive effect of silicon starting from the Schrödinger equation.
- What rank tensor is piezoresistance? Can it be observed in crystals of all point groups?
- Why would it be useful to know silicon's point group when calculating the elements of the piezoresistive tensor?
- NiTi alloys undergo structural phase transitions when stress is applied. How could this affect piezoresistance in these alloys?
Solution
Applying pressure to silicon changes the band gap. Describe how you could calculate the piezoresistive effect of silicon starting from the Schrödinger equation.
Pressure changes the arrangement of atoms in the crystal. For different arrangements the electronic band structure can be calculated. The electrical conductivity, which is directly related to the resistivity, can then be calculated from the Boltzmann equation (see question 4).
What rank tensor is piezoresistance? Can it be observed in crystals of all point groups?
Piezoresistance relates a rank 2 tensor (the resistivity) to another rank 2 tensor (stress) and is therefore rank 4,
\begin{equation*} \frac{\Delta\rho_{ij}}{\rho_0} = \pi_{ijkl}\sigma_{kl}. \end{equation*}As an even rank tensor in general it has non-zero components in crystals of all point groups.
Why would it be useful to know silicon's point group when calculating the elements of the piezoresistive tensor?
Because depending on the point group certain elements of the tensor must be the same as others or zero (see http://lampz.tugraz.at/~hadley/ss2/crystalphysics/crystalclasses/crystalclasses.html). While a generic fourth rank tensor has $3^4=81$ elements, most point groups only have a few independent elements.
NiTi alloys undergo structural phase transitions when stress is applied. How could this affect piezoresistance in these alloys?
The different crystal structures will have different piezoresistivity tensors and therefore, while applying stress there can be jumps in the piezoresistance when the structure changes.
6. Pyroelectricity
The pyroelectric coefficient describes how the polarization of a crystal changes as the temperature changes.
- Express the pyroelectric coefficient as a derivative of the Gibbs free energy.
- Assume Landau's theory of a second order phase transition can be used to describe polarization of the crystal. Sketch the pyroelectric coefficient as a function of temperature. What is the order parameter in this case?
- If you measured the pryoelectric coefficient as a function of temperature and the electric susceptibilty as a function of temperature you would be able to predict the specific heat as a function of temperature. Explain how this is possible.
Solution
Express the pyroelectric coefficient as a derivative of the Gibbs free energy.
The pyroelectric effect arises from a spontaneous variation of the dipole moment as the temperature rises, which leads to a spontaneous polarization. The corresponding definition of the pyroelectric coefficient $\pi$ (a rank 1 tensor) is
\begin{equation*} \pi_i = \frac{\partial P_i}{\partial T}. \end{equation*}Since the polarization $P_i$ can be expressed from the Gibbs energy as
\begin{equation*} P_{i}= \left(\frac{\partial G}{\partial E_{i}}\right)_{T,\sigma,H,\mu}, \end{equation*}the pyroelectric coefficient is given by
\begin{equation*} \pi_i = \frac{\partial^2 G}{\partial T \partial E_i }. \end{equation*}Assume Landau's theory of a second order phase transition can be used to describe polarization of the crystal. Sketch the pyroelectric coefficient as a function of temperature. What is the order parameter in this case?
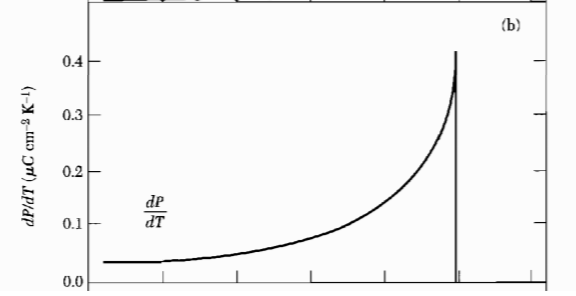 Figure 3: The temperature variation of the pyroelectlic coefficient $\frac{dP}{dT}$.
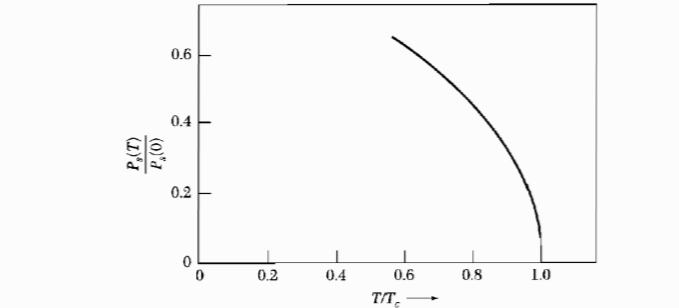 Figure 4: Spontaneous polarization vs temperature, for a second order phase transition.
The order of parameter in this case is the polarization.
If you measured the pryoelectric coefficient as a function of temperature and the electric susceptibilty as a function of temperature you would be able to predict the specific heat as a function of temperature. Explain how this is possible.
By measuring the pyroelectric coefficient and the electric susceptibility as a function of temperature we can determine the critical temperature. After determining $T_{c}$ one can calculate the $\alpha$ and $\beta$ factors from the second order phase transition Landau theory (see http://lampz.tugraz.at/~hadley/ss2/landau/second_order.php). Subsequently the specific heat is given through:
\begin{equation*} c_{V} = c_{V0}(T)+\frac{2\alpha_{0}^{2}T}{\beta} , \: T < T_{c} . \end{equation*}
7. Ferroelectric material.
- You have been asked to characterize a ferroelectric material. What are the characteristics that people using this ferroelectric would want to know? Describe the experiments you would perform to measure these characteristics.
Solution
You have been asked to characterize a ferroelectric material. What are the characteristics that people using this ferroelectric would want to know? Describe the experiments you would perform to measure these characteristics.
The most important characteristic is the Curie temperature of the material and we can measure it by measuring the heat capacity of the material at different temperature values. This will tell us where the Curie temperature lies, because the specific heat must have a divergence at a first order phase transition and a discontinuity at a second order phase transition.
8. Structural phase transition
Barium titanate is a ferroelectric that undergoes a first order structural phase transition from a rhombohedral phase to a monoclinic phase at about -80°C.
- What could be used as the order parameter? What symmetry is broken?
- Explain briefly what the Landau theory of first order phase transitions is.
- Sketch the specific heat and the electric susceptibility of barium titanate as a function of temperature. Where does the latent heat appear in these plots?
Solution
What could be used as the order parameter? What symmetry is broken?
The order parameter can be any quantity that is $0$ at one side of the phase transition and non-zero at the other. Since it is a structural phase transition one can use lattice parameters as order parameter, for example in this case $c/a-1$. Going from a rhombohedral phase to a monoclinic phase breaks the 3-fold rotational symmetry.
Explain briefly what the Landau theory of first order phase transitions is.
The Landau theory of phase transitions is based on the idea that the free energy can be expanded as a power series in the order parameter $m$. For a second order phase transition, the order parameter grows continuously from zero at the phase transition so the first few terms of the power series will dominate. If the free energy is expanded to sixth order in the order parameter, the system will undergo a first order phase transition if $\alpha_{0} > 0, \beta < 0, \gamma > 0 $
\begin{equation*} f(T) = f_{0}(T)+\alpha_{0}(T-T_{c})m^{2}+\frac{1}{2}\beta m^{4} + \frac{1}{3}\gamma m^{6} \end{equation*}Here $f_{0}(T)$ describes the temperature dependence of the high temperature phase near the phase transition.
Sketch the specific heat and the electric susceptibility of barium titanate as a function of temperature. Where does the latent heat appear in these plots?
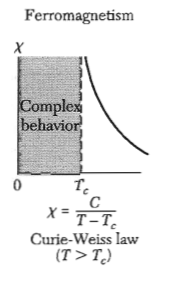 Figure 5: Magnetic susceptibility of a ferromagnet - The dielectric susceptibility of a ferroelectric shows the same behavior.
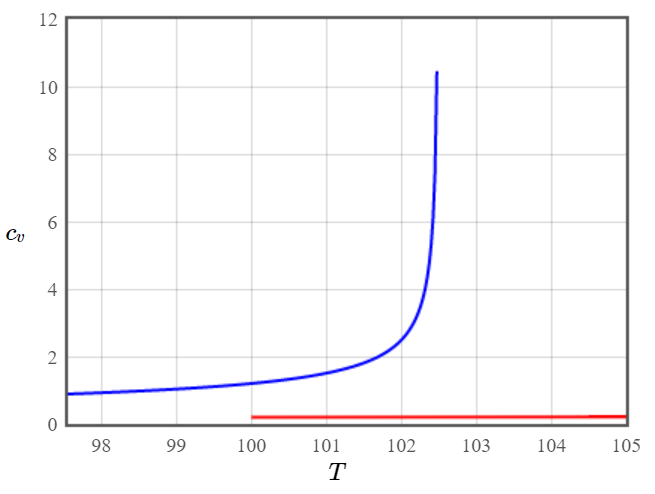 Figure 6: Specific heat for a ferroelectric material.
The latent heat appears in the divergence of the specific heat around the critical temperature. It shows that around that region we can put energy into the system without changing the temperature.
9. Metal-insulator transition
- Consider gold atoms arranged on an fcc lattice. The lattice constant of metallic gold is 4 Å. If the lattice constant were to be increased, the crystal would go through a metal-insulator transition. Describe how you could calculate the lattice constant at which this metal-insulator takes place. (Hint: the factor $1.19/a_{0} \approx 1~\mathrm{A}^{-1}$ is for metallic hydrogen.)
- How could you measure plasmons on the metal side of the transition and excitons on the insulating side of the transition?
- Plot the plasma frequency as a function of the lattice constant and the exciton energy as a function of the lattice constant.
Solution
Consider gold atoms arranged on an fcc lattice. The lattice constant of metallic gold is 4 Å. If the lattice constant were to be increased, the crystal would go through a metal-insulator transition. Describe how you could calculate the lattice constant at which this metal-insulator takes place. (Hint: the factor $1.19/a_{0} \approx 1~\mathrm{A}^{-1}$ is for metallic hydrogen.)
First we have to look at the screened potential curve given by
\begin{equation*} \phi(r) = -\frac{e}{4 \pi \epsilon_{0}r}\cdot e^{-k_{s}r} . \end{equation*}The next step is to determine for which factor $k_{s}$ the highest occupied state becomes unbound by solving the Schrödinger equation with that potential (see also question 1 in Electron-Electron Interactions). Once we have determined $k_s$ we can calculate the density $n$ from
\begin{equation*} k_{s}^2 = \frac{4}{a_{0}}\left(\frac{3n}{\pi}\right)^{\frac{1}{3}}. \end{equation*}From the density we are able to calculate the lattice constant.
How could you measure plasmons on the metal side of the transition and excitons on the insulating side of the transition?
Plasmons can be measured with electron energy loss spectroscopy (EELS, see question 7 in Linear Response Theory).
Excitons can be measured through absorption, because they introduce additional states below the conduction band minimum and transitions to these states appear in optical absorption spectra.
Plot the plasma frequency as a function of the lattice constant and the exciton energy as a function of the lattice constant.
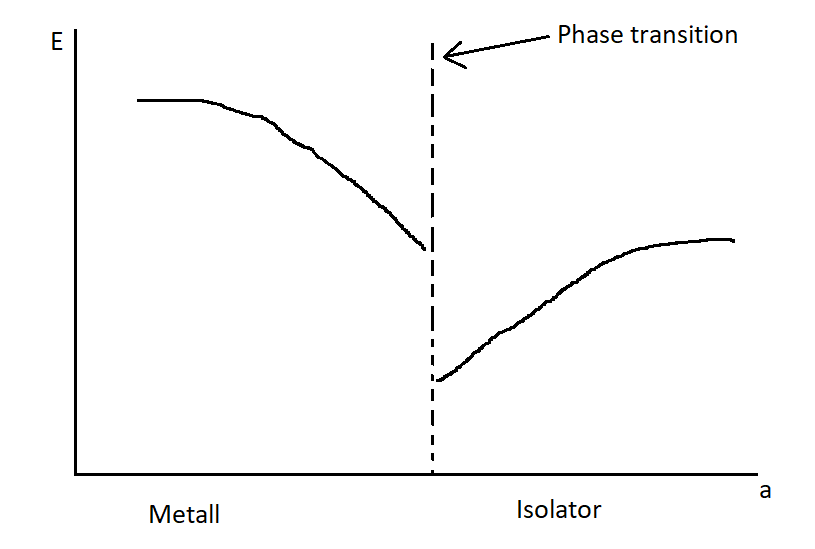 Figure 7: Plasma and exciton frequency as a function of the lattice constant.
The plasma frequency decreases as the lattice constant grows, while the exciton energy increases. The plasma frequency decreases because by increasing the lattice constant we decrease the electron density and that is directly related to the plasma frequency. The exciton energy increases, because the band gap becomes larger with increasing lattice constant.