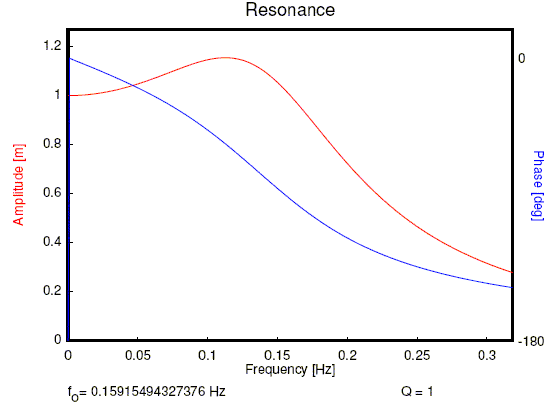
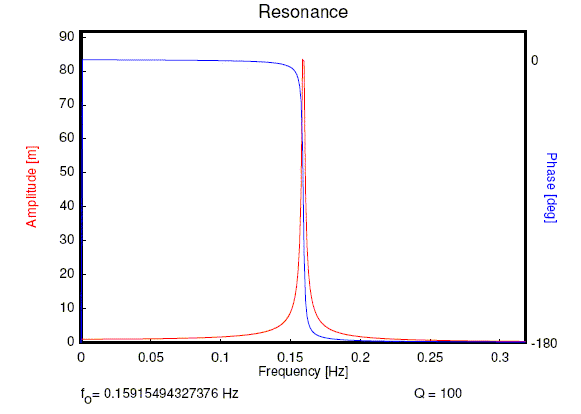
The red point represents F0eiωt and the blue point represents kAeiωt in the complex plane. The left image shows a low frequency where the drive and response are almost in phase. At higher frequencies the response lags behind the drive. For frequencies far above resonance, the response lags 180 degrees behind the drive. The amplitude of the response (the radius of the blue point) is frequency dependent. Resonance curves for Q = 1, 10, and 100 are shown below.


