Frequency dependent impedance measurements with the Stanford 830 lock-in amplifier
The aim of this laboratory is to measure the impedance of a capacitor and a diode. These measurements are executed with a Stanford 830 lock-in amplifier and a Stanford 570 Current amplifier.
A lock-in amplifier is a device to measure very weak electrical signals and give them a proper amplification.The Standford 830 lock-in amplifier represent a band-pass filter with a small bandwidth.
A short video that discusses the principles and applications of lock-in amplifiers in general can be found
here.
For more information concerning the setup of the lock-in amplifier (configuration of inputs, setting of time constants etc.)
see the webpage Frequency dependent impedance measurements from the course
"Semiconductor Laboratory".
To measure the impedance of a device or circuit, a sinusoidal voltage is applied to the device and the resulting sinusoidal current is measured. The current can have a phase shift with respect to the voltage.
The measurements were operated with Python and were done for
- a silicon diode on a wafer
- a capacitor with 100 pF
In order to communicate with the amplifier the following Python script is needed. StanfordResearchSystems and the SR830_Impedance are used to measure the the impedance.
The output of the script is the phase and the impedance, as well a plot of the data.
The measurement setup is shown in the following figures.
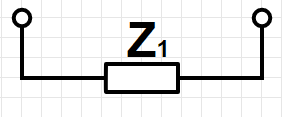
The Figure above shows the impedance of the cable and the Stanford SR830. In other words it shows a schematic diagram of a short circuit. This impedance you measure just by connecting the output and input with a BNC-cable.
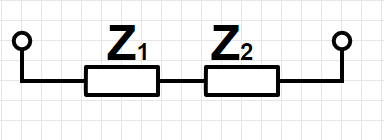
The next step is to measure the impedance of the second amplifier by connecting it with the Stanford SR830 and leave the second BNC-cable free.
We have a open circuit now and is shown in the schematic diagram below.
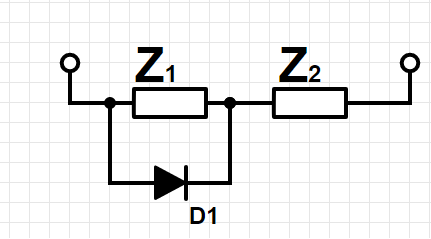
The last step is that to plug in the capacity as shown in the next figure and measure the impedance of the whole circuit.
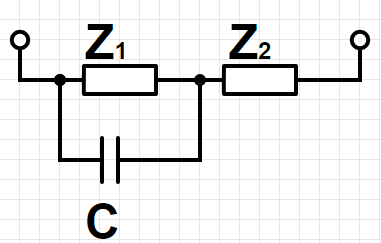
Here is the whole circuit shown in a schematic diagram.
Since $Z_1$ is known from the first measurement, you can calculate $Z_2$ with the second measurement. With the third measurement you can compute the resistance $X_c$ and the capacity $C$. The impedance of a resistor parallel to a capacitor is calculated by the conductance and is written
\begin{equation}
Z_p = \frac{1}{\sqrt{\frac{1}{R^2}+\frac{1}{X_c^2}}}
\end{equation}
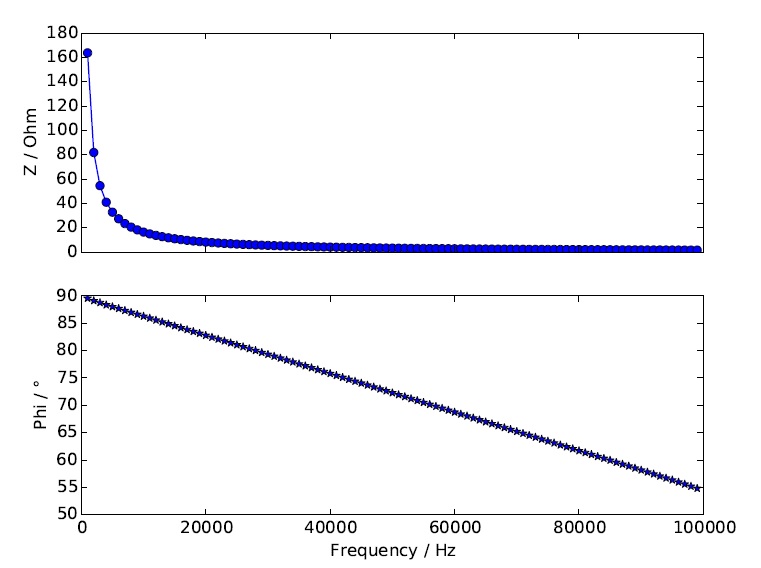
Finally calculate $X_c$ and the impedance results in the following fit of the impedance of the capacitor
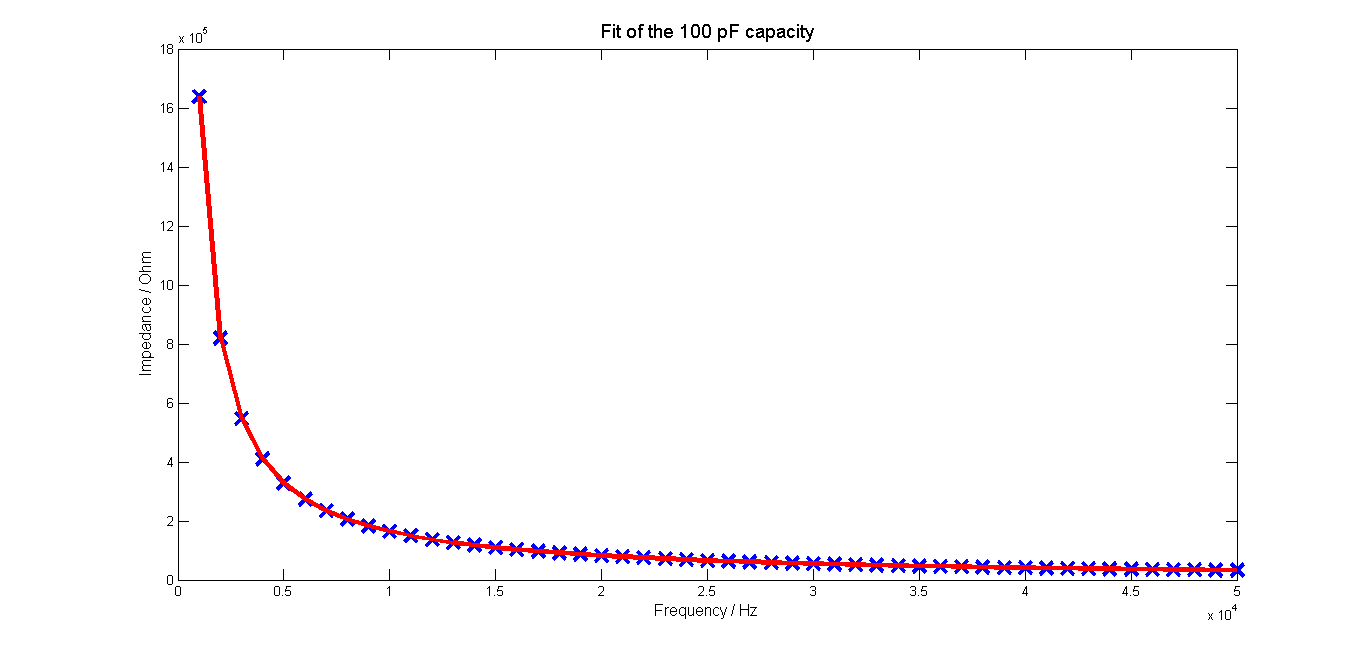
As expected the impedance gets smaller when the frequency is rising. The measured capacity of the condensator yield to 106 pF.
The same procedure you need to do now for the diode. At the beginning of the measurement you need to measure the diode with the diode2 and keithly script.
With both scripts you need to find out if you measure the diode in reverse or forward bias. The circuit diagram with diode is shown in the next figure.
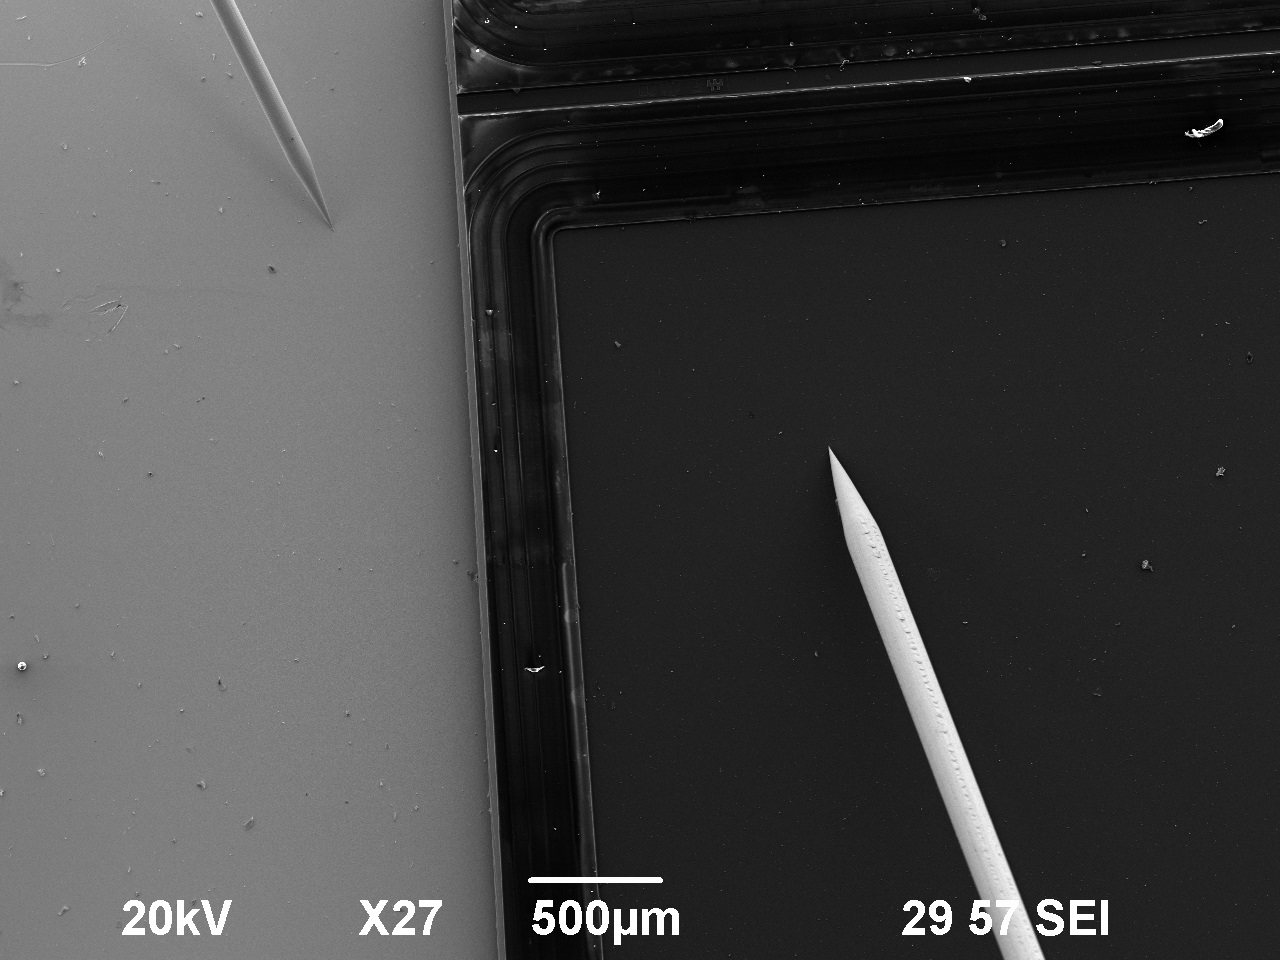
Since the diode is very small, a scanning electron microscope(SEM) is used. The SEM is provided with 4 tips which can measure during the SEM is operating.
The impedance of the diode is resulting in the following fit.

You can clearly see that the capacitance is decreasing with increasing frequency.
In the end a capacity of $513 fF$ was measured for the diode.
The next table shows the measured impedance of the open circuit.
Now the impedance of the short circuit is shown.
Note that an amplification of 100 $\mu$ A/V was used for all measurements.